


转自:***/dtrace.html
以下是使用 DTrace 的开源工具和示例,DTrace 是动态跟踪的实现,可在不同的操作系统(Solaris、Mac OS X、FreeBSD 等)中使用。DTrace 通过提供应用程序和系统内部的新的详细视图来帮助解决服务器上的问题,该视图达到了以前难以或无法访问的级别。它提供了一种编写 DTrace 脚本的语言,该语言类似于 C 和 awk,并且是基于事件的。有关更长的摘要,请参阅维基百科DTrace条目。
此网站包含我的许多第一个 DTrace 脚本,这些脚本是在 2004-5 年编写的,用于预发行版的 Solaris 10。这些被开发成一个名为DTraceToolkit 的集合,其中包含此处找到的较新版本的脚本。我最近的收藏发表在右图的DTrace书(Prentice Hall,2011)中,其中包含许多新脚本。这些新脚本可以在***网站上找到。
本页:Linux,指南,DTraceToolkit,DTrace One-Liners,Scripts,Examples,DTraceTazTool,DExplorer,Links.
操作系统
DTrace 可用于 Mac OS X、FreeBSD 和 Solaris 系列操作系统:Solaris 10、Oracle Solaris 11、SmartOS、OmniOS 以及任何其他基于 illumos 内核的系统。
此页上的许多 DTrace 脚本最初都是为 Solaris 10 编写的。有些可以在其他操作系统上运行而无需更改,有些则需要稍作调整才能运行。
Linux
从Linux 4.9开始,Linux内核终于有了与DTrace类似的原始功能。这是多年来合并在 Linux 内核中的许多跟踪项目和技术的高潮,包括:分析和 PMC 事件 (perf_events)、内核静态跟踪(跟踪点)、内核动态跟踪 (kprobes) 和用户动态跟踪 (uprobes)。以前的 Linux 跟踪器是 ftrace 和 perf_events。新的Linux跟踪器建立在所有这些之上,是增强的BPF,具有多个可用的前端:特别是bcc和bpftrace。请参阅我关于它的帖子:DTrace for Linux 2016 (eBPF) 和 DTrace for Linux 2018 (bpftrace)。我还有一个关于Linux eBPF跟踪的页面。
如果您想要类似 DTraceToolkit 的体验(预制工具),请查看BCC。如果你想要一个类似DTrace的体验(D编程),请查看bpftrace。我已经为两者发布了工具。
对于 eBPF 之前的 Linux 跟踪,我编写了一组 ftrace 和 perf_events 工具,类似于 DTraceToolkit,它们运行在较旧的 Linux 内核:perf-tools,我也在 LISA,Linux 性能分析:新工具和旧秘密中谈到了这一点。
附加组件呢,如SystemTap,ktap等?既然 eBPF 已经包含在 4.9 中,所有附加组件都应该考虑将 eBPF 用于后端功能。这始于2017年,并将在2019年继续,因为4.9内核的推出以及对eBPF工具的需求增加。为了看到这些附加示踪剂的一些旧材料,我确实有一个ktap页面,并在2014年做了一个演讲,从DTrace到Linux。至于DTrace本身,有两个项目可以将其移植到Linux:dtrace4linux项目,以及Oracle Linux的不同端口。这些端口似乎没有动力,而bcc / eBPF有。
指导
如何开始使用 DTrace?您可以通过仅运行脚本来使用 DTrace,也可以自己编写脚本。
使用 DTrace 脚本
不是每个人都有时间坐下来从头开始编写 DTrace 脚本,也没有时间学习如何编写。不用担心,网上有很多脚本可供下载和使用。您可以:
- 下载DTraceToolkit
- 查看 DTraceOneLiners。
- 请参阅DTrace 手册中的 DTrace 脚本和单行代码。
- 使用 /usr/demo/dtrace 或DTrace Guide 中的脚本。
- 从本网站或其他网站下载脚本。
- 在 DTrace邮件列表中搜索有用的脚本,或在 Internet 上的其他位置搜索。
编写 DTrace 脚本
有些人会编写自己的自定义 DTrace 脚本来排除故障或解决性能问题。
- 它有助于了解C
- 了解一点内核会有所帮助
- 天空是极限
要开始编写自己的脚本,请执行以下操作:
- 至少阅读《DTrace 指南》的第 1 章。
- 查看 DTraceOneLiners。
- 通读 DTrace示例。
- 学习脚本。最好的顺序是kill.d,bitesize.d,sshkeysnoop.d,shellsnoop.d。
- 有关脚本,请参阅其他网站。
- 下载DTraceToolkit
- 阅读DTrace 书籍。
- 参与 DTrace邮件列表。
注意:此站点上的许多 DTrace 脚本都包含在 Bourne shell 或 Perl 中,以提供命令行选项,从而允许通过遵循其他 Unix 工具的现有约定和样式,为系统管理员创建直观且易于学习的工具。
DTraceToolkit
请参阅DTraceToolkit 网站(请更新链接以指向它)。
地址:***/dtracetoolkit.html
DTrace One Liners
# New processes with arguments:
dtrace -n 'proc:::exec-success { trace(curpsinfo->pr_psargs); }'
# Files opened by process:
dtrace -n 'syscall::open*:entry { printf("%s %s",execname,copyinstr(arg0)); }'
# Syscall count by program:
dtrace -n 'syscall:::entry { @num[execname] = count(); }'
# Syscall count by syscall:
dtrace -n 'syscall:::entry { @num[probefunc] = count(); }'
# Syscall count by process:
dtrace -n 'syscall:::entry { @num[pid,execname] = count(); }'
# Read bytes by process:
dtrace -n 'sysinfo:::readch { @bytes[execname] = sum(arg0); }'
# Write bytes by process:
dtrace -n 'sysinfo:::writech { @bytes[execname] = sum(arg0); }'
# Read size distribution by process:
dtrace -n 'sysinfo:::readch { @dist[execname] = quantize(arg0); }'
# Write size distribution by process:
dtrace -n 'sysinfo:::writech { @dist[execname] = quantize(arg0); }'
# Disk size by process:
dtrace -n 'io:::start { printf("%d %s %d",pid,execname,args[0]->b_bcount); }'
# Pages paged in by process:
dtrace -n 'vminfo:::pgpgin { @pg[execname] = sum(arg0); }'
# Minor faults by process:
dtrace -n 'vminfo:::as_fault { @mem[execname] = sum(arg0); }'
# Profile user-level stacks at 99 Hertz, for PID 189:
dtrace -n 'profile-99 /pid == 189 && arg1/ { @[ustack()] = count(); }'
脚本
下面演示了每个程序的操作 带有下载代码的链接。(注意:要获得最新版本的 一个特定的脚本,还要检查DTraceToolkit中的版本)。
IOSnoop是一个用于窥探磁盘I / O活动的程序。在这里我们可以观看直播是什么 发生在我们的磁盘上,包括负责的 PID 和命令。 输出包括磁盘操作的块地址和大小 – 这是您第一次可以实时观看磁盘的运行情况。
# iosnoop UID PID D BLOCK SIZE COMM PATHNAME 100 15795 R 3808 8192 tar /usr/bin/eject 100 15795 R 35904 6144 tar /usr/bin/eject 100 15795 R 39828 6144 tar /usr/bin/env 100 15795 R 3872 8192 tar /usr/bin/expr 100 15795 R 21120 7168 tar /usr/bin/expr 100 15795 R 43680 6144 tar /usr/bin/false 100 15795 R 44176 6144 tar /usr/bin/fdetach 100 15795 R 3920 8192 tar /usr/bin/fdformat 100 15795 R 3936 8192 tar /usr/bin/fdformat 100 15795 R 4080 8192 tar /usr/bin/fdformat 100 15795 R 9680 3072 tar /usr/bin/fdformat [...]下面说明了由熟悉的 Unix 命令引起的磁盘活动。 iosnoop 在 Solaris 10 x86 服务器上执行,并绘制了数据 – 磁盘磁头位置(红色)和传输大小(蓝色)。点击查看大图:
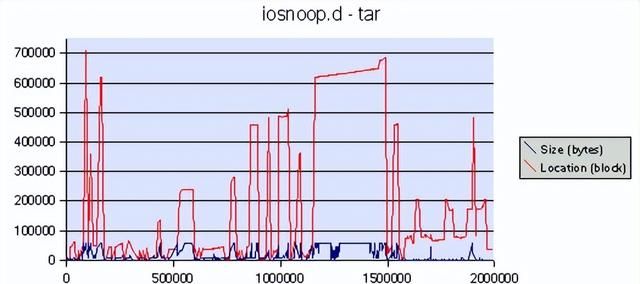
在这里,执行了一个tar命令(tar cvf /dev/null /var)来存档目录,而iosnoop捕获了磁盘活动的前2秒。当 tar 读取目录时会观察到一些分散的活动,并且当 tar 遇到大文件时可以观察到顺序传输。
- 更多 iosnoop 示例包含更多演示和情节。
- 独立 iosnoop.d是一个 DTrace 这里只有带有示例的版本, 旧的 pre-io 提供商 iosnoop.d就在这里。
- psio是另一个启用了 DTrace 的磁盘 I/O 工具。
iotop按进程显示顶部磁盘 I/O 事件。 这将按进程跟踪磁盘 I/O,并打印摘要 每隔一段时间刷新一次的报告。 完整示例。首次发布。检查更新。
# iotop -CSampling... Please wait.2005 Jul 16 00:31:38, load: 1.03, disk_r: 5023 Kb, disk_w: 22 Kb UID PID PPID CMD DEVICE MAJ MIN D BYTES 0 27740 20320 tar cmdk0 102 16 W 23040 0 27739 20320 find cmdk0 102 0 R 668672 0 27740 20320 tar cmdk0 102 16 R 1512960 0 27740 20320 tar cmdk0 102 3 R 3108864 2005 Jul 16 00:31:43, load: 1.06, disk_r: 8234 Kb, disk_w: 0 Kb UID PID PPID CMD DEVICE MAJ MIN D BYTES 0 27739 20320 find cmdk0 102 0 R 1402880 0 27740 20320 tar cmdk0 102 3 R 7069696[...]execsnoop是一个窥探进程活动的程序。执行进程时 在服务器上打印出他们的详细信息。另一个用户已登录 运行一些命令,如下所示。这特别有用 对原本难以发现的短期进程进行故障排除。 更多例子。
# execsnoop UID PID PPID CMD 100 3008 2656 ls 100 3009 2656 ls -l 100 3010 2656 cat /etc/passwd 100 3011 2656 vi /etc/hosts 100 3012 2656 date 100 3013 2656 ls -l 100 3014 2656 ls 100 3015 2656 finger [...]- Execsnoop可以选择添加日期和时间(-v),或观看 特定命令(-c 命令)。
- 独立 execsnoop.d是原始的仅限 DTrace 的版本。
- C 版本:execsnoop.c是为了比较 libdtrace C 使用者和 D 脚本之间的开销而编写的。
opensnoop是一个程序来窥探文件打开。文件名和文件句柄 与一些过程详细信息一起跟踪。 更多例子。
# opensnoop -g UID PID PATH FD ARGS 100 3528 /var/ld/ld.config -1 cat /etc/passwd 100 3528 /usr/lib/libc.so.1 3 cat /etc/passwd 100 3528 /etc/passwd 3 cat /etc/passwd 100 3529 /var/ld/ld.config -1 cal 100 3529 /usr/lib/libc.so.1 3 cal 100 3529 /usr/share/lib/zoneinfo/Australia/NSW 3 cal 100 3530 /var/ld/ld.config -1 ls -l 100 3530 /usr/lib/libc.so.1 3 ls -l 100 3530 /var/run/name_service_door 3 ls -l 100 3530 /usr/share/lib/zoneinfo/Australia/NSW 4 ls -l 100 3531 /var/ld/ld.config -1 uname -a 100 3531 /usr/lib/libc.so.1 3 uname -a[...]- Opensnoop 可以选择添加日期和时间 (-v),或观看 特定文件名(-f 路径名)。
- 独立 opensnoop.d是原始的 DTrace 唯一的版本..
RWSNOOPSnoop 读/写事件。 这是在应用程序级别测量读取和写入 – 系统调用。 完整示例。
# rwsnoop UID PID CMD D BYTES FILE 0 2924 sh R 128 /etc/profile 0 2924 sh R 128 /etc/profile 0 2924 sh R 128 /etc/profile 0 2924 sh R 84 /etc/profile 0 2925 quota R 757 /etc/nsswitch.conf 0 2925 quota R 0 /etc/nsswitch.conf 0 2925 quota R 668 /etc/passwd 0 2926 cat R 55 /etc/motd 0 2926 cat W 55 /devices/pseudo/pts@0:12 100 20334 sshd R 56 /devices/pseudo/clone@0:ptm 100 20334 sshd W 100 <unknown> 0 2926 cat R 0 /etc/motd 0 2927 mail R 757 /etc/nsswitch.conf 0 2927 mail R 0 /etc/nsswitch.conf 0 2927 mail R 275 /etc/group 0 2927 mail R 668 /etc/passwd 0 2924 sh R 0 /etc/profile[...]rwtop display top read/write bytes by process. rwtop prints a summary report that is refreshed at intervals. This is measuring reads and writes at the application level – syscalls. Full example.
# rwtop2005 Jul 24 05:00:13, load: 1.01, app_r: 38 Kb, app_w: 8 Kb UID PID PPID CMD D BYTES 0 245 1 utmpd R 4 0 20320 20347 bash R 21 100 20317 20314 sshd R 26 100 20317 20314 sshd W 68 0 2934 20320 ps W 140 0 20320 20347 bash W 216 0 7 1 svc.startd R 672 0 2935 20320 df W 1225 0 2936 20320 ls W 1466 0 2936 20320 ls R 2485 100 20334 20331 sshd R 4241 100 20334 20331 sshd W 5717 0 2934 20320 ps R 31567tcpsnoop snoop TCP network packets by process. This analyses TCP network packets and prints the responsible PID and UID, plus standard details such as IP address and port. This captures traffic of newly created TCP connections that were established while this program was running. It can help identify which processes is causing TCP traffic. Full example. new release. check for updates.
# tcpsnoop.d UID PID LADDR LPORT DR RADDR RPORT SIZE CMD 100 20892 192.168.1.5 36398 -> 192.168.1.1 79 54 finger 100 20892 192.168.1.5 36398 -> 192.168.1.1 79 54 finger 100 20892 192.168.1.5 36398 <- 192.168.1.1 79 54 finger 0 242 192.168.1.5 23 <- 192.168.1.1 54224 54 inetd 0 242 192.168.1.5 23 -> 192.168.1.1 54224 54 inetd 0 242 192.168.1.5 23 <- 192.168.1.1 54224 54 inetd 0 242 192.168.1.5 23 <- 192.168.1.1 54224 78 inetd 0 242 192.168.1.5 23 -> 192.168.1.1 54224 54 inetd 0 20893 192.168.1.5 23 -> 192.168.1.1 54224 57 in.telnetd 0 20893 192.168.1.5 23 <- 192.168.1.1 54224 54 in.telnetd 0 20893 192.168.1.5 23 -> 192.168.1.1 54224 78 in.telnetd 0 20893 192.168.1.5 23 <- 192.168.1.1 54224 57 in.telnetd 0 20893 192.168.1.5 23 -> 192.168.1.1 54224 54 in.telnetd [...]- Standalone tcpsnoop.d is a DTrace only version..
tcptop display top TCP network packets by process. This captures traffic of newly created TCP connections that were established while this program was running. It can help identify which processes is causing TCP traffic. Full example. first release. check for updates.
# tcptop -C 30Sampling... Please wait.2005 Jul 5 05:18:56, load: 1.07, TCPin: 3 Kb, TCPout: 112 Kb UID PID LADDR LPORT RADDR RPORT SIZE NAME 0 242 192.168.1.5 79 192.168.1.1 54283 272 inetd 0 242 192.168.1.5 23 192.168.1.1 54284 294 inetd 0 20929 192.168.1.5 79 192.168.1.1 54283 714 in.fingerd 100 20926 192.168.1.5 36409 192.168.1.1 79 1160 finger 100 20927 192.168.1.5 36410 192.168.1.1 79 1160 finger 100 20928 192.168.1.5 36411 192.168.1.1 23 1627 telnet 0 20313 192.168.1.5 22 192.168.1.1 54285 2798 sshd 0 20931 192.168.1.5 23 192.168.1.1 54284 4622 in.telnetd 100 20941 192.168.1.5 858 192.168.1.1 514 115712 rcp 2005 Jul 5 05:19:26, load: 1.04, TCPin: 0 Kb, TCPout: 4 Kb UID PID LADDR LPORT RADDR RPORT SIZE NAME 100 20942 192.168.1.5 36412 192.168.1.1 79 1160 finger 0 20931 192.168.1.5 23 192.168.1.1 54284 7411 in.telnetd [...]udpsnoop.d snoop UDP network I/O by process. This analyses UCP network I/O and prints the responsible PID and UID, plus standard details such as IP address and port. This tracks UDP read/writes by payload. Full example. first release! check for updates.
# udpsnoop.d UID PID LADDR LPORT DR RADDR RPORT SIZE CMD 0 27127 192.168.1.5 35534 -> 192.168.1.1 53 29 nslookup 0 27127 192.168.1.5 35534 <- 192.168.1.1 53 181 nslookup 1 221 192.168.1.5 111 <- 192.168.1.1 37524 56 rpcbind 1 221 192.168.1.5 111 -> 192.168.1.1 37524 28 rpcbind 0 27128 192.168.1.5 35116 <- 192.168.1.1 37524 40 rpc.sprayd 0 27128 192.168.1.5 35116 -> 192.168.1.1 37524 24 rpc.sprayd 0 27128 192.168.1.5 35116 <- 192.168.1.1 37524 44 rpc.sprayd 0 27128 192.168.1.5 35116 <- 192.168.1.1 37524 44 rpc.sprayd 0 27128 192.168.1.5 35116 <- 192.168.1.1 37524 44 rpc.sprayd 0 27128 192.168.1.5 35116 <- 192.168.1.1 37524 44 rpc.sprayd 0 27128 192.168.1.5 35116 <- 192.168.1.1 37524 44 rpc.sprayd 0 27128 192.168.1.5 35116 <- 192.168.1.1 37524 44 rpc.sprayd 0 27128 192.168.1.5 35116 <- 192.168.1.1 37524 44 rpc.sprayd 0 27128 192.168.1.5 35116 <- 192.168.1.1 37524 44 rpc.sprayd 0 27128 192.168.1.5 35116 <- 192.168.1.1 37524 44 rpc.sprayd 0 27128 192.168.1.5 35116 <- 192.168.1.1 37524 44 rpc.sprayd 0 27128 192.168.1.5 35116 <- 192.168.1.1 37524 40 rpc.sprayd 0 27128 192.168.1.5 35116 -> 192.168.1.1 37524 36 rpc.sprayd ^Cconnections snoop inbound TCP connections as they are established, displaying the server process that accepted the connection. Full example is here.
# connections UID PID CMD TYPE PORT IP_SOURCE 0 242 inetd tcp 79 192.168.1.1 0 359 sshd tcp 22 192.168.1.1 100 1532 Xorg tcp 6000 192.168.1.1 ^Cprustat This displays %CPU, %Mem, %Disk and %Net utilisation by process. To examine all four key performance areas by process in Solaris was prohibitivly difficult without DTrace. prustat also uses Perl, Kstat and the procfs structures from /proc/*/*. It is a new tool and still under development, released as a demonstration. Full example.
# prustat -t5 5 PID %CPU %Mem %Disk %Net COMM22301 65.01 3.17 0.00 0.00 setiathome 440 8.91 45.39 0.00 0.00 Xsun 2618 0.33 14.34 0.00 0.00 mozilla-bin 582 4.01 2.16 0.00 0.00 gnome-terminal 574 1.80 1.31 0.00 0.00 metacity PID %CPU %Mem %Disk %Net COMM22694 3.74 0.20 74.47 0.00 tar22301 66.70 3.17 0.00 0.00 setiathome 440 6.67 45.39 0.00 0.00 Xsun 2618 0.33 14.34 0.00 0.00 mozilla-bin22693 3.81 1.50 0.00 0.00 dtrace PID %CPU %Mem %Disk %Net COMM22301 63.72 3.17 0.00 0.00 setiathome 440 8.14 45.39 0.00 0.00 Xsun22694 6.47 0.20 36.47 0.00 tar22698 0.00 0.00 6.88 22.43 rcp 2618 0.34 14.34 0.00 0.00 mozilla-bin^Cdtruss This is a DTrace version of truss, designed to be less of a burden and safer than truss. In the below example, dtruss examines all processes named "bash" and prints out regular truss output plus elapsed and overhead times. See the full example.
# dtruss -eon bashPID/LWP ELAPSD OVERHD SYSCALL(args) = return 3911/1: 41 26 write(0x2, "l", 0x1) = 1 0 3911/1: 1001579 43 read(0x0, "s", 0x1) = 1 0 3911/1: 38 26 write(0x2, "s", 0x1) = 1 0 3911/1: 1019129 43 read(0x0, " 01", 0x1) = 1 0 3911/1: 38 26 write(0x2, " ", 0x1) = 1 0 3911/1: 998533 43 read(0x0, "-", 0x1) = 1 0 3911/1: 38 26 write(0x2, "-01", 0x1) = 1 0 3911/1: 1094323 42 read(0x0, "l", 0x1) = 1 0 3911/1: 39 27 write(0x2, "l01", 0x1) = 1 0 3911/1: 1210496 44 read(0x0, "r", 0x1) = 1 0[...]procsystime This program provides process system call details such as elapsed time from entry to return, overhead time for CPU time consumed, and counts. In the example below we examine "ssh" processes. Full example.
# procsystime -a -n sshHit Ctrl-C to stop sampling...^C Elapsed Times for process ssh, SYSCALL TIME (ns) read 295392 write 622903 pollsys 1030310531 CPU Times for process ssh, SYSCALL TIME (ns) read 183515 write 534289 pollsys 650729 Syscall Counts for process ssh, SYSCALL COUNT read 12 write 12 pollsys 24hotuser Sample on-CPU user-level functions and libraries. This samples at 1000 Hertz, for a simple yet effective user-level profiling tool. The output will identify which function is on the CPU the most – which is the hottest. The following examples show hotuser analysing gunzip and gzip. Full example.
# ./hotuser -c 'gunzip contents.gz'Sampling... Hit Ctrl-C to end. FUNCTION COUNT PCNTlibc.so.1`_free_unlocked 1 0.1%gunzip`unzip 1 0.1%ld.so.1`strcmp 1 0.1%gunzip`inflate_dynamic 1 0.1%libc.so.1`_write 1 0.1%gunzip`write_buf 1 0.1%gunzip`0x2d990 2 0.3%libc.so.1`write 2 0.3%gunzip`0x2d994 2 0.3%ld.so.1`rtld_db_preinit 3 0.4%gunzip`0x2d98c 7 0.9%gunzip`huft_build 9 1.2%libc_psr.so.1`memcpy 138 18.5%gunzip`inflate_codes 233 31.2%gunzip`updcrc 344 46.1% # ./hotuser -lc 'gzip contents'Sampling... Hit Ctrl-C to end. LIBRARY COUNT PCNTlibc.so.1 2 0.0%libc_psr.so.1 37 0.9%gzip 4113 99.1%hotkernel Sample on-CPU kernel-level functions and modules. This samples at 1000 Hertz, for a simple yet effective modules-level profiling tool. The output will identify which function is on the CPU the most – which is the hottest. The following examples show hotkernel analyse an x86 kernel. Full example.
# ./hotkernelSampling... Hit Ctrl-C to end.^CFUNCTION COUNT PCNTunix`swtch 1 0.1%pcplusmp`apic_redistribute_compute 1 0.1%genunix`strrput 1 0.1%unix`sys_call 1 0.1%genunix`fsflush_do_pages 1 0.1%TS`ts_wakeup 1 0.1%genunix`callout_schedule_1 1 0.1%unix`page_create_putback 1 0.1%unix`mutex_enter 4 0.3%unix`cpu_halt 1575 99.2% # ./hotkernel -mSampling... Hit Ctrl-C to end.^CMODULE COUNT PCNTusbms 1 0.0%specfs 1 0.0%uhci 1 0.0%sockfs 2 0.0%genunix 28 0.6%unix 4539 99.3% dapptrace This traces user and library function usage. This is similar to the "apptrace" command, however can fetch extra details such as function elapsed times and on-cpu times. Below is a demonstration of running dapptrace on the banner command, the user function calls are being traced. Full example.
# dapptrace -eoF banner hi # # # # # # ###### # # # # # # # # # # ELAPSD CPU CALL(args) = return . . -> __fsr(0x2, 0x8047D7C, 0x8047D88) 41 4 <- __fsr = 122 . . -> main(0x2, 0x8047D7C, 0x8047D88) . . -> banner(0x8047E3B, 0x80614C2, 0x8047D38) . . -> banset(0x20, 0x80614C2, 0x8047DCC) 29 6 <- banset = 36 . . -> convert(0x68, 0x8047DCC, 0x2) 26 3 <- cOnvert= 319 . . -> banfil(0x8061412, 0x80614C2, 0x8047DCC) 25 2 <- banfil = 57 . . -> convert(0x69, 0x8047DCC, 0x2) 23 1 <- cOnvert= 319 . . -> banfil(0x8061419, 0x80614CA, 0x8047DCC) 23 1 <- banfil = 57 309 28 <- banner = 118 . . -> banprt(0x80614C2, 0x8047D38, 0xD27FB824) 349 322 <- banprt = 74dappprof This profiles user and library function usage. This is a companion to dapptrace, where summary data is printed rather than a snoop of events. Below is a demonstration of running dappprof on the banner command. Full example.
# dappprof -ceoT banner hello # # ###### # # #### # # # # # # # ###### ##### # # # # # # # # # # # # # # # # # # # # ###### ###### ###### #### CALL COUNT__fsr 1main 1banprt 1banner 1banset 1convert 5banfil 5TOTAL: 15 CALL ELAPSEDbanset 38733banfil 150280convert 152113banner 907212__fsr 1695068banprt 1887674TOTAL: 4831080 CALL CPUbanset 7710convert 9566banfil 11931__fsr 15199banner 52685banprt 776429TOTAL: 873520 dvmstat This program provides vmstat like data for one particular PID, a process name, or when running a command. It prints statistics every second. Here we monitor a "find" processes, and can clearly see it exhaust the cache (dropping "re" reclaims), and then defer to disk (increasing "maj" major faults and "fpi" filesystem pageins). Full example.
# dvmstat -n find re maj mf fr epi epo api apo fpi fpo sy 0 0 0 0 0 0 0 0 0 0 0 0 0 0 0 0 0 0 0 0 0 0 6336 0 372 0 0 0 0 0 0 0 22255 1624 0 0 0 0 0 0 0 0 0 5497 2292 0 0 0 0 0 0 0 0 0 7715 13064 0 0 0 0 0 0 0 0 0 43998 7972 168 0 0 0 0 0 0 168 0 38361 468 636 0 0 0 0 0 0 636 0 13774 376 588 0 0 0 0 0 0 588 0 10723 80 636 0 0 0 0 0 0 656 0 11078 48 772 0 0 0 0 0 0 812 0 9841 16 1028 0 0 0 0 0 0 1056 0 10752 0 1712 0 0 0 0 0 0 1740 0 12176 4 1224 0 0 0 0 0 0 1236 0 9024 topsyscall This program continually prints a report of the top system calls, and refreshes the display every 1 second or as specified. Full example.
2005 Jun 14 02:26:40, load average: 0.16, 0.18, 0.21 syscalls: 1381 SYSCALL COUNT waitsys 5 getuid 5 xstat 7 munmap 7 brk 8 sysconfig 8 open 8 getpid 9 close 9 resolvepath 10 setcontext 18 setitimer 25 mmap 26 lwp_sigmask 32 lwp_park 41 write 78 read 78 sigaction 113 pollsys 318 ioctl 526shellsnoop captures the text input and output live from shells running on the system. In this example shellsnoop was run in one window, while in another several commands were run: date, cal and uname -a. (this is like a simple version of ttywatcher). Full example is here.
# shellsnoop PID PPID CMD DIR TEXT 4724 3762 ksh R 4724 3762 ksh W date 4741 4724 date W Sun Mar 28 23:10:06 EST 2004 4724 3762 ksh R 4724 3762 ksh W jupiter:/etc/init.d> 4724 3762 ksh R 4724 3762 ksh R 4724 3762 ksh W cal 4742 4724 cal W March 2004 4742 4724 cal W S M Tu W Th F S 4742 4724 cal W 1 2 3 4 5 6 4742 4724 cal W 7 8 9 10 11 12 13 4742 4724 cal W 14 15 16 17 18 19 20 4742 4724 cal W 21 22 23 24 25 26 27 4742 4724 cal W 28 29 30 31 4742 4724 cal W 4724 3762 ksh R 4724 3762 ksh W jupiter:/etc/init.d> 4724 3762 ksh R 4724 3762 ksh R 4724 3762 ksh W uname -a 4743 4724 uname W SunOS jupiter 5.10 s10_51 i86pc i386 i86pc 4724 3762 ksh R- Shellsnoop has options to view a particular PID only, and to only view data printed – which is somewhat spooky.
- Standalone shellsnoop.d is the original DTrace only version..
kill.d This simple DTrace program watches who is sending signals to processes. In the example below, the bash shell successfully sent a "kill -2" (SIGINT) to PID 3117, and failed to send a "kill -9" (SIGKILL) to process 12345,
# kill.d FROM COMMAND SIG TO RESULT 2344 bash 2 3117 0 2344 bash 9 12345 -1^Cerrinfo reports on system call failures with full errno details to help explain why these errors occured. It has two styles of output: a "snoop" style to watch events (the default), and a "count" style to provide a summary (-c). Both are demonstrated below, Full example.
# errinfo EXEC SYSCALL ERR DESCgnome-netstatus- ioctl 12 Not enough core mozilla-bin lwp_park 62 timer expired Xorg read 11 Resource temporarily unavailable Xorg pollsys 4 interrupted system call mozilla-bin lwp_park 62 timer expired mozilla-bin lwp_park 62 timer expired Xorg read 11 Resource temporarily unavailable^C# errinfo -cSampling... Hit Ctrl-C to end.^C EXEC SYSCALL ERR COUNT DESCgnome-netstatus- ioctl 12 1 Not enough core miniserv.pl waitsys 10 1 No childrengnome-settings-d read 11 1 Resource temporarily unavailable metacity read 11 1 Resource temporarily unavailable gnome-panel read 11 1 Resource temporarily unavailable nautilus read 11 1 Resource temporarily unavailable dsdm read 11 2 Resource temporarily unavailable soffice.bin read 11 2 Resource temporarily unavailable java_vm lwp_cond_wait 62 4 timer expired svc.startd portfs 62 5 timer expired Xorg pollsys 4 15 interrupted system call Xorg read 11 26 Resource temporarily unavailable mozilla-bin lwp_park 62 58 timer expiredsshkeysnoop.d从在同一服务器上运行的 SSH 客户端命令捕获击键。 虽然密码清晰可见,但这不是安全问题 使用 Solaris 10 更像是 DTrace 的强大功能的演示。完整示例。
# sshkeysnoop.d UID PID PPID TYPE TEXT 100 9651 8600 cmd ssh -l fred mars 100 9651 8600 key f 100 9651 8600 key r 100 9651 8600 key e 100 9651 8600 key d 100 9651 8600 key 1 100 9651 8600 key 2 100 9651 8600 key 3 100 9651 8600 key[...]短命。这个简单的 DTrace 程序测量短时间消耗了多少时间 生活过程。这通常很难通过采样发现 像PRSTAT这样的工具。在下面的示例中,许多生存期较短的“expr”命令 实际上消耗了大约 45% 的 CPU。完整示例在这里。
# shortlived.dSampling.. Hit Ctrl-C to stop.^Cshort lived processes: 3.394 secs total sample duration: 7.543 secs Total time by process name, ls 14 ms df 18 ms expr 3049 ms Total time by PPID, 2765 32 ms 29752 3049 mscputimes打印内核/空闲/进程消耗的 CPU 时间。默认输出 将 CPU 时间细分打印为三类,内核时间、空闲时间 以及流程消耗的时间;全部在纳秒内完成。完整示例。
# cputimes 1 32005 Apr 27 23:37:58, KERNEL 10795499 PROCESS 20941091 IDLE 9707074432005 Apr 27 23:37:59, KERNEL 8919418 PROCESS 77446789 IDLE 9105550402005 Apr 27 23:38:00, KERNEL 8615123 PROCESS 78314246 IDLE 810100417cpudists按内核/空闲/进程打印CPU时间分布。默认输出 按三个类别打印 CPU 时间使用情况:内核时间、空闲时间 和处理时间。该值是以纳米为单位的时间和计数 是出现次数。完整示例。
# cpudists 5 12005 Apr 28 00:08:42, KERNEL value ------------- Distribution ------------- count 4096 | 0 8192 |@@@@@@@@@@@@@@@@@@@@@@@@@@@@ 1134 16384 |@@@@@@@@@ 344 32768 |@@@ 104 65536 | 3 131072 | 0 PROCESS value ------------- Distribution ------------- count 8192 | 0 16384 |@@@@@@@@@ 170 32768 |@@@@@@@@@@@@@@@@@@ 331 65536 |@@@@@@@@ 152 131072 |@ 17 262144 |@ 25 524288 |@ 13 1048576 | 4 2097152 | 0 IDLE value ------------- Distribution ------------- count 2097152 | 0 4194304 |@ 9 8388608 |@@@@@@@@@@@@@@@@@@@@@@@@@@@@@@@@@@@@@ 418 16777216 |@@@ 31 33554432 | 0setuids.dsnoop setuid calls.这可用于监视用户登录和“su”使用情况。 完整示例在这里。
# setuids.d UID SUID PPID PID PCMD CMD 0 100 3037 3040 in.telnetd login -p -h mars -d /dev/pts/12 100 0 3040 3045 bash su - 0 102 3045 3051 sh su - fred 0 100 3055 3059 sshd /usr/lib/ssh/sshd 0 100 3065 3067 in.rlogind login -d /dev/pts/12 -r mars 0 100 3071 3073 in.rlogind login -d /dev/pts/12 -r mars 0 102 3078 3081 in.telnetd login -p -h mars -d /dev/pts/12 [...]bitesize.d是一个简单的程序,用于检查进程使用 磁盘 – 它们是否会导致大型 I/O 操作或许多小“咬”? 在下面的示例中,我们可以看到 find 命令主要导致 1K 事件,而 tar 命令每次操作传输更多数据。 完整示例。
# bitesize.d Sampling... Hit Ctrl-C to end.^C PID CMD 7109 find / value ------------- Distribution ------------- count 512 | 0 1024 |@@@@@@@@@@@@@@@@@@@@@@@@@@@@@@@@@@ 1452 2048 |@@ 91 4096 | 33 8192 |@@ 97 16384 | 0 3 fsflush value ------------- Distribution ------------- count 4096 | 0 8192 |@@@@@@@@@@@@@@@@@@@@@@@@@@@@@@@@@@@@@@@@ 449 16384 | 0 7108 tar cf /dev/null / value ------------- Distribution ------------- count 256 | 0 512 | 70 1024 |@@@@@@@@@@ 1306 2048 |@@@@ 569 4096 |@@@@@@@@@ 1286 8192 |@@@@@@@@@@ 1403 16384 |@ 190 32768 |@@@ 396 65536 | 0 [...]seeksize.d按进程打印磁盘磁头寻道距离。这可以识别 进程是以“随机”还是“顺序”方式访问磁盘 方式。下面的示例说明了顺序访问。用 Seeksize.d 与 bitesize.d 结合使用。完整示例。
# seeksize.d Sampling... Hit Ctrl-C to end.^C PID CMD 22349 scp /dl/sol-10-b63-x86-v1.iso mars: value ------------- Distribution ------------- count -1 | 0 0 |@@@@@@@@@@@@@@@@@@@@@@@@@@@@@@@@@@@@@@ 726 1 | 0 2 | 0 4 | 0 8 |@ 13 16 | 4 32 | 0 [...]zvmstat 是 vmstat的 DTrace 版本,用于打印每个区域的信息。 更多例子在这里。
# zvmstat 1 ZONE re mf fr sr epi epo epf api apo apf fpi fpo fpf global 54 316 1 0 0 0 0 0 0 0 0 1 1 workzone1 0 0 0 0 0 0 0 0 0 0 0 0 0 ZONE re mf fr sr epi epo epf api apo apf fpi fpo fpf global 157 659 1 0 10 0 0 0 0 0 3 2 1 workzone1 770 1085 0 0 48 0 0 0 0 0 928 0 0 ZONE re mf fr sr epi epo epf api apo apf fpi fpo fpf global 56 317 0 0 6 0 0 0 0 0 2 0 0 workzone1 1478 21 0 0 0 0 0 0 0 0 1635 0 0 [...]zhostid是一个 DTrace 守护程序,用于将每个区域的主机 ID 更改为不同的值。 更多例子在这里。
global# ./zhostid &[1] 8717global# hostid12345678global# global# zlogin workzone1[Connected to zone 'workzone1' pts/10]Last login: Tue Jun 21 03:51:10 on pts/10Sun Microsystems Inc. SunOS 5.10 Generic January 2005 # # hostid90abcdef套接字侦听此程序窥探套接字 按进程划分数据传输事件,确定哪个进程负责 用于在网络上读取或写入数据。 完整示例。
# socketsnoop.d UID PID DIR SIZE CMD 0 19886 W 64 ssh mars 0 19886 R 80 ssh mars 0 19915 W 0 finger @mars 0 19915 W 2 finger @mars 0 19915 R 633 finger @mars 0 19915 R 0 finger @mars 0 19886 W 64 ssh mars 0 19886 R 80 ssh mars 0 19886 W 48 ssh mars 0 19886 R 80 ssh mars 100 4789 W 6 vncviewer mars:4 100 4789 R 348 vncviewer mars:4 100 4789 W 10 vncviewer mars:4 [...]Anonprofile.d是一个窥探匿名内存使用情况的程序 按流程。这提供了进程匿名内存的配置文件 随时间推移的大小。它可以帮助解决内存问题 软件开发。 更多例子在这里。
# anonprofile.d UID PID TOTAL ARGS 0 14380 4169728 /usr/sbin/dtrace -s anonprofile.d 100 14382 4096 bash 100 14382 8192 ls -l 100 14382 12288 ls -l 100 14382 20480 ls -l 100 14382 24576 ls -l 100 14382 28672 ls -l 100 14382 57344 ls -l 100 14382 65536 ls -l 100 14382 73728 ls -l 100 14382 106496 ls -l 100 14382 110592 ls -l 100 14382 118784 ls -l 100 14382 126976 ls -l 100 14382 131072 ls -l 100 14382 135168 ls -l 100 14382 143360 ls -l[...]intrtime Time spent by the kernel in interrupt threads was previously difficult to measure. intrtime gives a break down of the interrupt types and times spent servicing each. Full example.
# intrtime 1 Interrupt Time(ns) %Time uhci_intr 23753 0.00 ata_intr 3698089 0.37 i8042_intr 7360399 0.73 gld_intr 12319508 1.22 TOTAL(int) 23401749 2.31 TOTAL(dur) 1012546207 100.00 typewriter-0.75.tar.gz This makes your console keyboard sound like a mechanical keyboard. This is for entertainment only.
# ./ultra5.d &[1] 7660typewriter.d running for the console keyboard. #Troubleshooting Examples
These are examples of performing troubleshooting using DTrace, and often begin by using DTrace at the command line before using DTrace scripts such as the tools above.
DTrace vs truss this demonstrates the performace impact of using DTrace vs truss. DTrace is designed to minimise the burden on the system while it is running.
DTracing SMC here we have a quick look at using DTrace to investigate the behaviour of SMC when it is first executed. SMC is a system administration GUI that takes a while the first time it is run as it compiles Java classes.
DTracing Lost CPU here we take a look at a mysterious problem where the CPUs are busy, but there dosen't appear to be any processes responsible for this. Where has the CPU time gone?
prstat vs top this analyses the CPU overhead of running prstat vs running top. In the past some people have suggested that top is a CPU hog – DTrace can measure it.
DTraceTazTool
Several years ago, Richard McDougall wrote taztool – a GUI to display disk activity in an amazing and intuitive way. It used TNF trace data – a predecessor of DTrace. DTraceTazTool is a DTrace version of taztool. It is currently in development, and as such this is an alpha release. There are many more features to code, but it may already prove a useful tool.
The current version of DTraceTazTool is: DTaz-0.51.
The following image shows DTraceTazTool tracing the activity of a UFS file system as it was archived by the tar command. For the top plot: the requested block location is on the Y-axis, time is on the X-axis, and the colour reflects the number of requests for that location (many == red). The bottom plot shows maximum and average seek distance,
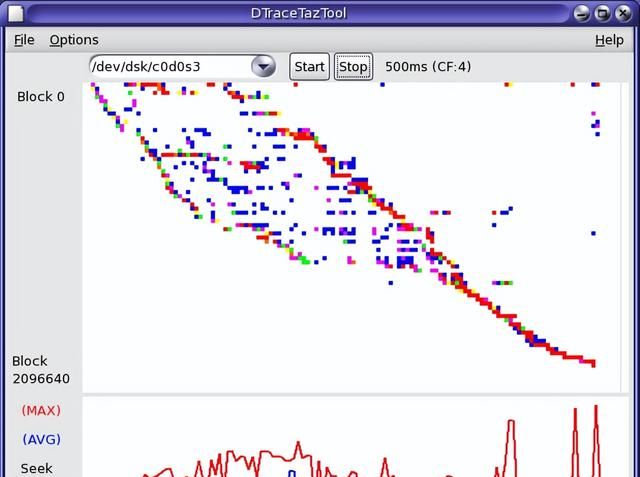
粗红线表示连续的磁盘活动, 分散的蓝色块表示随机磁盘活动。
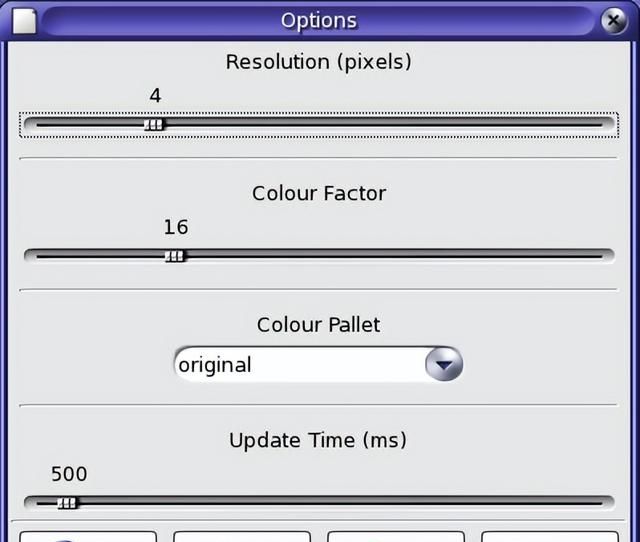
DTraceTazTool 已经有一些可调选项,如 绘制的像素和采样率,
DTraceTazTool 需要以 root 用户身份运行,或者以用户身份运行。 dtrace_kernel特权。
DExplorer
探险家搜索器自动运行一组 DTrace 脚本进行检查 系统的许多区域,并将输出放在一个有意义的目录中 焦油和 gzip 的结构。下面是一个示例 版本 0.70。 完整示例。
# dexplorerOutput dir will be the current dir (/export/home/root/DTrace/Dexplorer).Hit enter for yes, or type path:Starting dexplorer ver 0.70.Sample interval is 5 seconds. Total run is > 100 seconds. 0% Interrupts by CPU... 5% Interrupt counts... 10% Dispatcher queue length by CPU... 15% Sdt counts... 20% Pages paged in by process name... 25% Files opened count... 30% Disk I/O size distribution by process name... 35% Minor faults by process name... 40% Vminfo data by process name... 45% Mib data by mib statistic... 50% TCP write bytes by process... 55% Sample process @ 1000 Hz... 60% Syscall count by process name... 65% Syscall count by syscall... 70% Read bytes by process name... 75% Write bytes by process name... 80% Sysinfo counts by process name... 85% New process counts with arguments... 90% Signal counts... 95% Syscall error counts...100% Done.File is de_jupiter_200506271803.tar.gz## ls -l de_jupiter_200506271803.tar.gz-rw-r--r-- 1 root root 6346 Jun 27 18:05 de_jupiter_200506271803.tar.gz 输出文件可用于发送给其他人进行分析。
链接
书:
- DTrace: Dynamic Tracing in Oracle Solaris, Mac OS X and FreeBSD-Brendan Gregg, Jim Mauro (Prentice Hall, 2011).
- Solaris Performance and Tools: DTrace and MDB Techniques for Solaris 10 and OpenSolaris- Richard McDougall, Jim Mauro, Brendan Gregg(Prentice Hall, 2006).
- DTrace 指南- DTrace Team
其他 DTrace 脚本:
- DTrace book- 来自 DTrace book 的脚本。
- Solaris Internals-Richard McDougall的DTrace脚本。
外部 DTrace 链接:
- 布伦丹的博客 – 我的专业博客(见dtrace标记的帖子)。
- The Wall-我的个人博客,包括DTraceToolkit公告。
- 观景台 – 布莱恩·坎特里尔的博客(DTrace Team)。
- Adam Leventhal's Blog-(DTrace Team)。
- $<blog- Mike Shapiro的博客(DTrace Team)。
- 上下文切换 DTrace- 包含我的研讨会演示幻灯片。
- DTT 演示文稿 – Stefan Parvu 的 DTrace 和 DTraceToolkit 演示。
- DTrace Community-(已停用)OpenSolaris DTrace 社区网站。
- BigAdmin DTrace-(已退休)Sun的BigAdmin DTrace网站。
本网页内容旨在传播知识,若有侵权等问题请及时与本网联系,我们将在第一时间删除处理。E-MAIL:dandanxi6@qq.com